Impact Data Management and KPI Monitoring for Investors
You ask your investees or local data collection entities to collect insightful data on your beneficiaries, so you can observe your investment’s performance and generate evidence for it.
Survey and Analysis Framework Design
You can choose among three options:
1
Integrate your own frameworks and KPI indicators
2
Select surveys from our library of standardized frameworks
3
Need a customized solution? We can help you design the perfect framework.
Digitization of KPI & Form Creation
If you want to use your own survey, send us your questions.
We will create the form in the most suitable format (webform or app) for your data collection partners and send you
a demo link for testing.
We use open source data collection standards and build our digital
forms with Open Data Kit
and Enketo open source software and always keep up to date on the latest software developments,
collaborating with a large network of developers around the world.
Our mobile survey application supports many answer and documentation types:
Multiple choice and open questions
Images and file upload
Audio and video recording
GPS coordinates
The mobile and webforms are compatible with the data collection apps and the data management systems used by KoboToolbox and Survey CTO.
Want to know whether field, phone, or direct data collection best fits your needs?

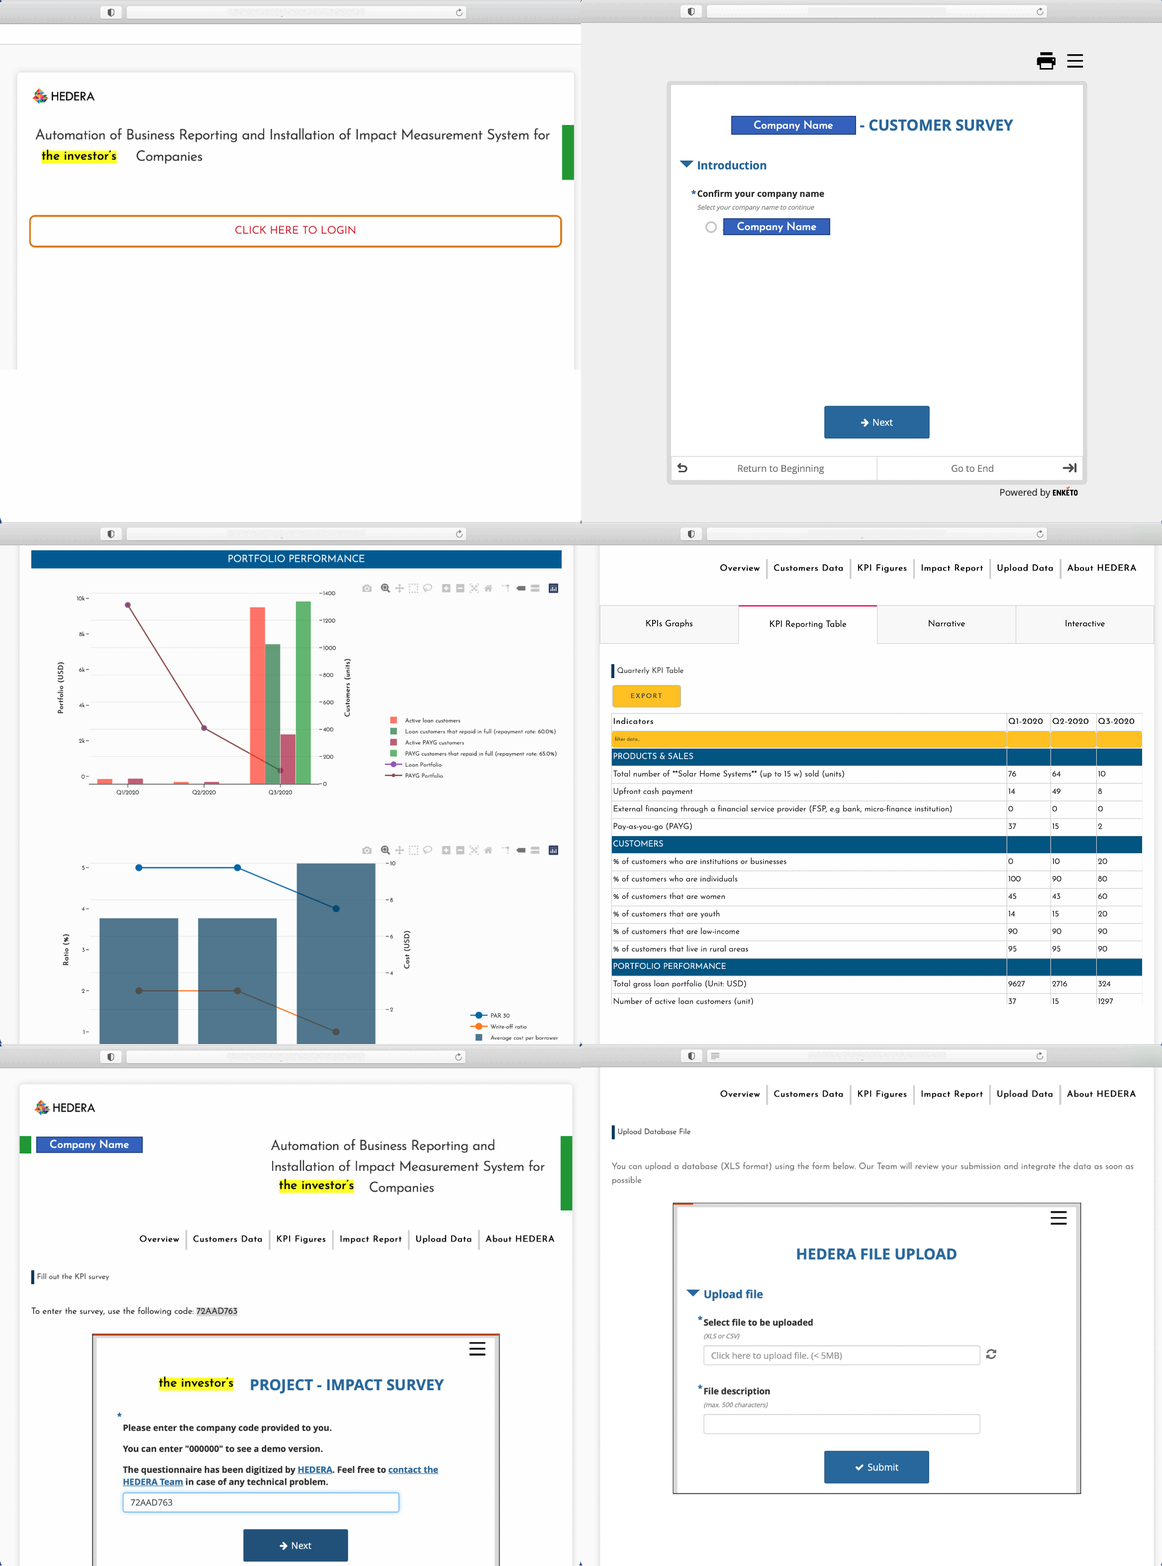
Data collection with the mobile app or webform
Customer-centric assessment:
the data collectors can interview your beneficiaries using our mobile survey application.
It is easy to install and use and does not require an internet connection.
Alternatively, people can be interviewed on the phone or even complete the surveys themselves.
Investees KPIs:
Your partners can report you using a webform, without the need of external software.
Our digital survey optimization, automated consistency checks, support services,
remote enumerator training, and ongoing data monitoring mechanism ensure high data quality.
Data aggregation, mapping and visualization
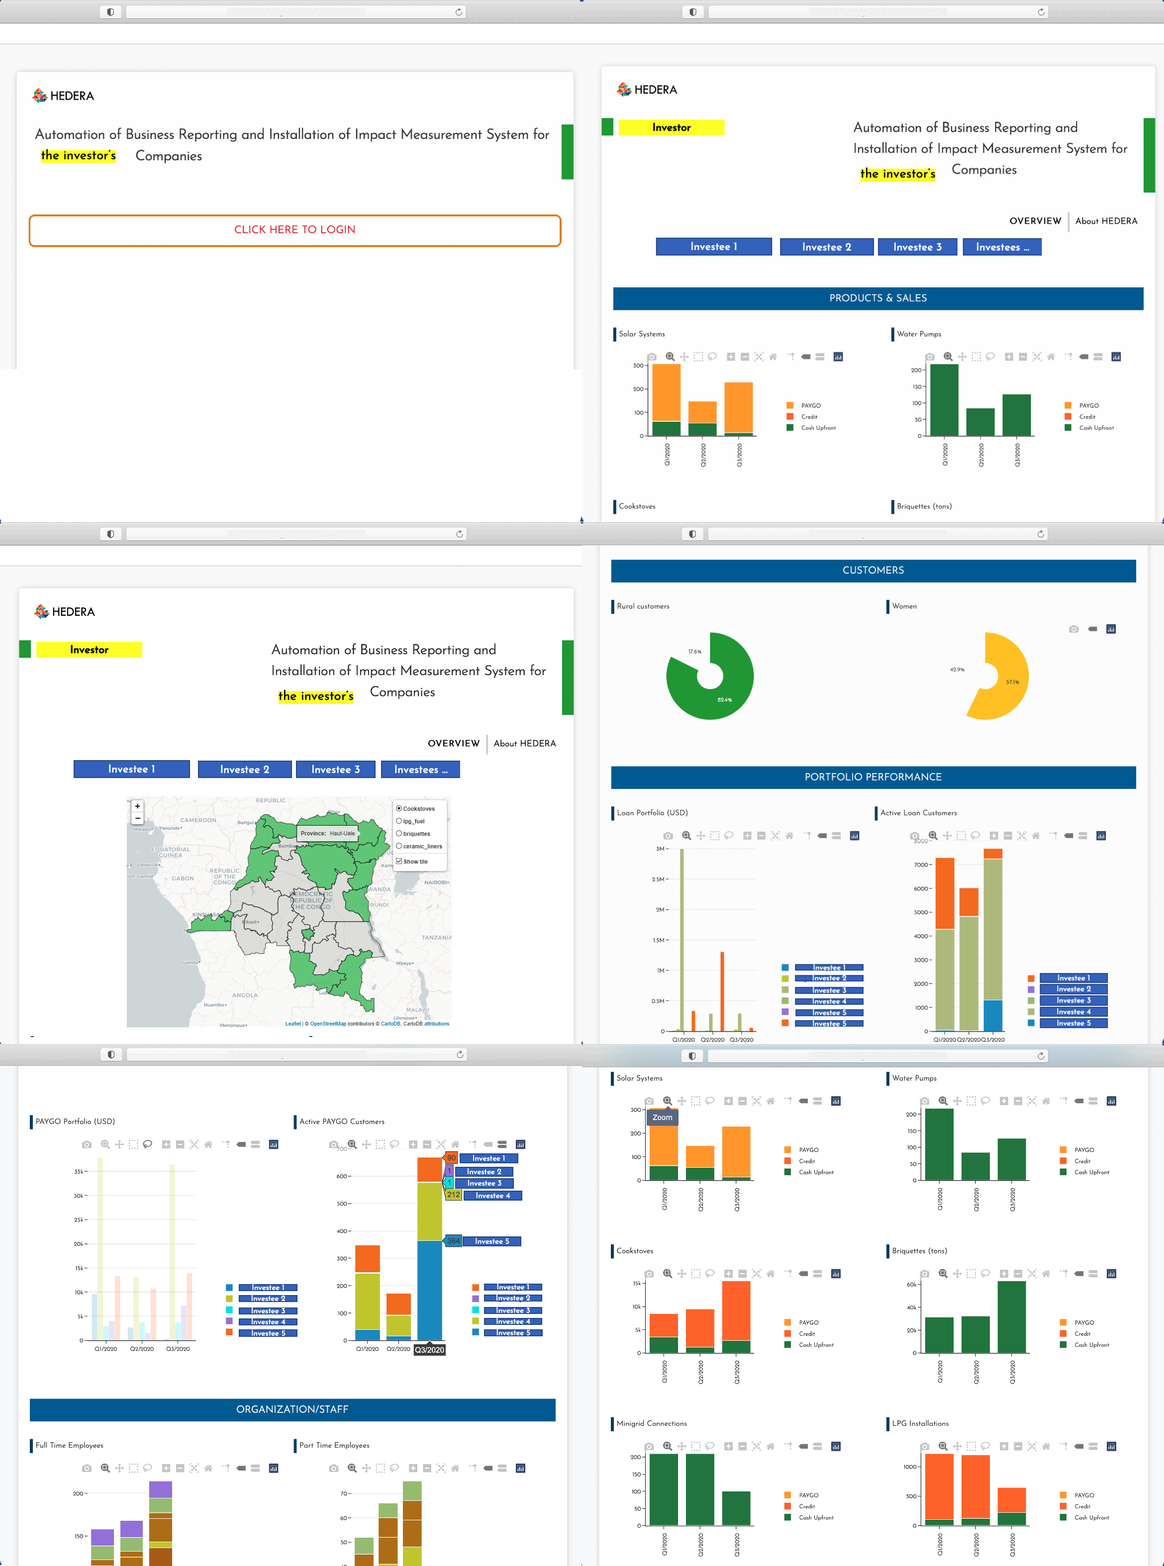
Your password-protected dashboard visualizes and analyzes the data according to your impact framework. It aggregates evidence from multiple sources, so you can view your portfolio performance.
Visualizations and statistical analysis provide deep insights into your beneficiaries’ needs, your achieved social impact, and potential for improvement.
The dataset can also be downloaded and exported as a CSV/Excel file or with custom APIs, so you can transfer it to an internal/ in-house data management system.
Want to import previous data or a connect to an additional database? Ask us, we will customize the product for you accordingly.

